
How to Read Oshikatsu Market Size: Comparing Survey Data and Applying It to Business Planning

When researching the market size of oshikatsu (active fan support activities), you will frequently encounter differing figures, such as approximately 3.8 trillion yen or approximately 4.1 trillion yen. When citing these figures in a business proposal or project plan, it is critical not just to look at the sheer scale of the amount, but to verify whose spending was estimated, when it occurred, and what types of expenditures were included.
Here, we compare published reports from CDG/Oshicoco, Nomura Research Institute (NRI), and Intage to break down how to read market sizes, participant populations, and average expenditures. For the fundamentals of oshikatsu culture and vocabulary, please refer to our comprehensive guide, What Is Oshikatsu? The Complete Guide.
Align Survey Conditions Before Comparing Estimates
Market estimates derived from questionnaire surveys are fundamentally different from measured sales figures aggregated across every retail cash register and corporate sales records in Japan. The calculated population and total spending change substantially depending on the target ages of respondents, how questions are phrased, and the scope of expenditures included.
For example, asking whether someone “has an oshi” (a favorite person, character, or entity they passionately support) is entirely different from asking whether they “actively engage in oshikatsu.” In addition, the year the survey was conducted does not necessarily match the calendar year respondents reviewed when recalling their expenses. When selecting reference materials, make it a rule to check the conducting organization, implementation timing, target age range, question phrasing, and the expenditure recall period first.
CDG and Oshicoco
- January 2026 survey of 23,125 individuals aged 15–69 residing in Japan
- 24.0% actively engage in oshikatsu (estimated at approximately 19.4 million people)
- Estimated a market size of roughly 4.1 trillion yen based on 2025 spending answers
Nomura Research Institute
- Column published on August 29, 2025
- Market size of approximately 3.8 trillion yen and ~26 million participants as of March 2025
- [object Object]
Intage
- January 2026 survey of 5,000 nationwide respondents aged 15–79
- 33.6% report having an oshi (a person, character, or object of support)
- Highlights patterns broken down by age group, gender, and oshi genre
CDG and Oshicoco: The ~4.1 Trillion Yen Market Is an Estimate Based on 2025 Spending Answers
The third survey released by CDG and Oshicoco on January 30, 2026 (in Japanese), was conducted between January 15 and 22, 2026, sampling 23,125 male and female respondents aged 15 to 69 residing in Japan. This survey applied weighting back-adjustments to mirror the demographic gender and age composition of national population estimates.
Respondents who stated that they “actively engage in oshikatsu” accounted for 24.0%, translating to an estimated population of approximately 19.4 million people. Among those participating in oshikatsu, reported annual expenditures averaged 209,716 yen, with a median of 40,000 yen. Based on these inputs, the overall market size was estimated at approximately 4.1 trillion yen. It is worth noting that the figures respondents reported as annual spending reflected the money they spent between January and December 2025, the calendar year prior to the survey.
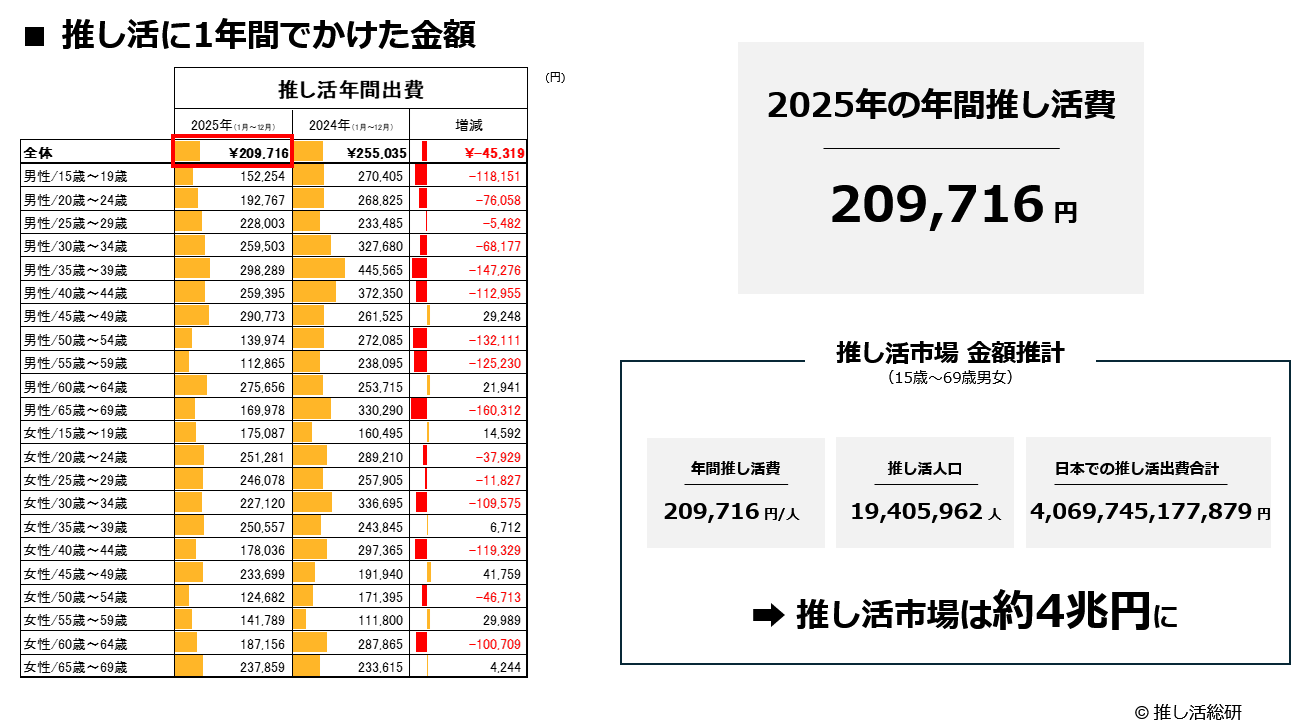
The diagram illustrates how the total market size is derived by multiplying annual per-person expenditures by the participating oshikatsu population. The “approximately 4.1 trillion yen” cited in the press text and the “approximately 4 trillion yen” shown in the diagram represent the exact same estimate, differing only by rounding conventions. Simply because this was made public in 2026 does not mean it reflects a finalized aggregate transaction volume for the entirety of 2026.
Furthermore, the mention in the materials of the oshikatsu population exceeding 20 million people during 2026 was a forward-looking projection at the time of publication. When citing these materials, distinguish carefully between the population estimated from actual survey responses and subsequent future forecasts.
What the ~210,000 Yen Average and 40,000 Yen Median Reveal
The average (mean) represents total spending smoothed evenly across respondents who actively engage in oshikatsu, while the median represents the middle value when all answers are arranged in ascending order. The noticeable gap between the two provides a key clue that spending varies widely across participants. However, a median of 40,000 yen does not justify concluding that “the vast majority of fans spend around 40,000 yen.” A median value alone does not tell you how many individuals are clustered closely around that specific midpoint.
Likewise, the average annual spend of around 210,000 yen is a figure derived solely from the answers of people who actively engage in oshikatsu; it is neither a national average across all citizens nor an “appropriate” benchmark amount that fans ought to spend. Differences in personal spending should never be used to rank or evaluate the sincerity of support or the depth of affection a fan possesses.
In corporate planning, teams must also avoid directly substituting this overall annual average for the average customer spend on their own specific products. That annual total combines expenditures across a wide variety of activities throughout the year. Companies must separately investigate who will realistically have budget to spend, and under what specific circumstances, for the specific products or services they plan to offer.
NRI: Mapping the Scope of Consumption Across Four Categories
A column published by Nomura Research Institute (NRI) on August 29, 2025 (in Japanese), estimated the oshikatsu participant population at approximately 26 million people and the annualized market size at roughly 3.8 trillion yen as of March 2025. A defining feature of this study is its division of spending into four clear categories:
| Spending Category | Definition and Examples Provided in the Report | Approximate Scale |
|---|---|---|
| Official Consumption (Kōshiki Shōhi) | Spending on merchandise and events provided directly by IP content holders | ~1.5 trillion yen |
| Voluntary Consumption (Jishu Shōhi) | Spending on activities fans initiate autonomously without direct official oversight, such as celebrating an oshi’s birthday | ~1.0 trillion yen |
| Incidental Consumption (Fuzui Shōhi) | Incidental expenses such as travel and lodging to meet an oshi, or purchasing cameras to photograph them | ~1.1 trillion yen |
| Collaboration Consumption (Korabo Shōhi) | Selecting everyday products or services—such as beverages or insurance policies—specifically because they feature an oshi tie-in | ~0.3 trillion yen |
Because each figure is rounded to an approximate sum, adding them up directly does not mathematically match the total estimated figure of roughly 3.8 trillion yen. In this framework, transportation and lodging fall under “incidental consumption,” meaning this category encompasses far more than just food and drink shared among fellow fan peers.
These four categories provide a valuable framework for determining where a company’s planned initiative intersects with fan activity. Are you creating official licensed merchandise? Are you providing spaces for fans to hold self-organized birthday celebrations? Are you assisting travel logistics for distant tour stops? Or are you running a collaboration tie-in on everyday consumer goods? Rather than merely waving around the grand total of the entire market, narrowing your focus to the exact scenario your business addresses makes it far easier to evaluate necessary feature requirements and barriers to participation.
NRI’s ~3.8 trillion yen estimate and CDG/Oshicoco’s ~4.1 trillion yen estimate rely on different methodologies and baseline definitions. One cannot simply treat the numerical difference between them as genuine year-over-year market growth, nor can the divergence between 26 million and 19.4 million participants be cited as evidence of population decline.
Intage: 33.6% “Have an Oshi” and Demographic Breakdowns
A research release published by Intage on September 10, 2026 (in Japanese), surveyed 5,000 men and women aged 15 to 79 across Japan between January 14 and 19, 2026. Samples were drawn from the company’s Mighty Monitor panel and collected in alignment with national census distributions for gender, age, and regional location.
Across all respondents, 33.6% answered that they “have an oshi” (someone or something they passionately support). Among respondents aged 15 to 19, this reached 75.9% for females and 61.7% for males. Even within the same age bracket, participation ratios differed markedly by gender, as did the preferred genres of their favorites. For instance, among males aged 15 to 19, 22.1% identified anime as their oshi genre, while 16.8% identified YouTuber/VTuber.
These figures describe the specific 15–19 age group at the time the survey was conducted; they cannot be casually equated to the entirety of Generation Z, which is defined by birth year cohorts. Moreover, both the target age range and question phrasing differ from those used in the CDG and Oshicoco survey. Rather than judging one survey as inherently more accurate than the other, or assuming participation shifted for a single specific reason simply because 33.6% is larger than 24.0%, planners should present each finding alongside the exact question asked.
Instead of broadly defining a project’s audience as “young people,” specifying their age bracket, the nature of their oshi, and the exact contexts in which they interact with products will clarify what additional information your team needs to gather. Aggregate percentages indicate broad demographic tendencies, but they do not dictate the personal preferences of individual fans.
Checklist for Using Market Data in Business Proposals
- 01Verify survey premisesCheck and align conducting organizations, timing, age ranges, question wording, and expense recall periods
- 02Define the targeted fan activityClarify where the offering fits among official, voluntary, incidental, or collaboration spending contexts
- 03Assess pricing and participation barriersAvoid treating average spend as a universal budget; evaluate actual user touchpoints and financial burden
- 04Specify the scope of all cited figuresDistinguish estimates and rounded sums from future forecasts; never treat gaps between different surveys as growth
When citing market figures in project proposals or strategy documents, always provide brief context regarding the premises, such as: “Estimated based on 2025 reported expenditures from a January 2026 survey covering ages 15–69.” Macro-market estimates, sector-specific sales, and individual corporate financial reports each rely on different scopes and calculation methodologies; verify what was counted before attempting to combine them.
From there, rigorously evaluate the specific contexts where your product becomes indispensable, the price points target users can afford, and the procedural friction required to participate or apply. A sound planning workflow uses aggregate data to narrow the target focus, while filling in remaining unknowns through direct retail observation and direct feedback from real users.
To learn more about putting these principles into practice, explore our detailed guide on What Is Oshikatsu Marketing? Strategies and Implementation.
FAQ
What is the estimated market size of oshikatsu?
Estimates vary depending on the research organization and how the calculations are defined. For example, a survey conducted in January 2026 by CDG and Oshicoco (Oshikatsu Research Institute) estimated the market at approximately 4.1 trillion yen (displayed as approximately 4 trillion yen in their diagrams), based on respondents' reported annual spending between January and December 2025. Meanwhile, a column published in August 2025 by the Nomura Research Institute (NRI) presented an estimate of roughly 3.8 trillion yen per year as of March 2025.
Why do oshikatsu population estimates and participation rates differ between surveys?
The discrepancy comes from differences in target age groups and how survey questions are worded. In the January 2026 survey by CDG and Oshicoco (covering ages 15 to 69), 24.0% of respondents—an estimated 19.4 million people—answered that they 'actively engage in oshikatsu.' In contrast, Intage's January 2026 survey (covering ages 15 to 79) found that 33.6% of respondents 'have an oshi.' Furthermore, NRI's estimate as of March 2025 put the population at approximately 26 million. It is essential to align the target populations and question definitions when evaluating these numbers.
How much does a fan spend annually on oshikatsu per person?
In the January 2026 survey by CDG and Oshicoco, active participants reported spending an average of 209,716 yen on oshikatsu between January and December 2025, while the median annual spend was 40,000 yen. The mean smooths out total spending across respondents who actively engage in oshikatsu, whereas the median represents the exact middle value of the distribution. Rather than assuming that most fans cluster tightly around 40,000 yen based on the median alone, or treating the average as an appropriate baseline budget, both metrics should be reviewed together.
What should businesses keep in mind when citing market size data in planning documents?
You should confirm and clearly cite the survey date, the recall period for expenditures, the respondents' age range, whether the question asked if they 'have an oshi' or 'actively engage in oshikatsu,' and which spending categories (such as official merchandise, voluntary fan activities, incidental consumption, or collaboration products) are included in the calculation. Be careful not to calculate growth rates or market expansion directly by contrasting numbers from entirely different surveys.


